
Part 07: Debugging with Copilot
In this section, you’ll learn how to use Copilot to debug an exception in your application.
Analyze the exception
Section titled “Analyze the exception”-
Debug the AppHost project if it isn’t yet, and open the store from the .NET Aspire dashboard.
-
Click on the Go to About button in the navigation menu.
-
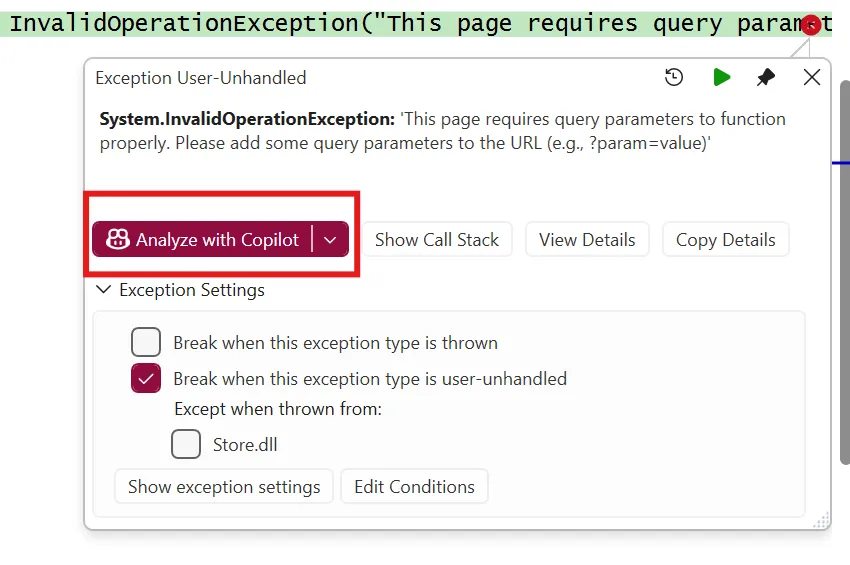
Observe that an exception occurs, and the application crashes.
-
Press the Analyze with Copilot option in the pop up. This will open the Debugger agent.
-
Review how Copilot brings in debugger information, including stack traces and variable states.
-
Note how Copilot recommends a fix for the issue or provides code suggestions to resolve it.
Key Takeaway: Copilot can assist in diagnosing and fixing exceptions by analyzing debugger information and providing actionable recommendations.
Using Watch Windows and Visualizers
Section titled “Using Watch Windows and Visualizers”In this subsection, you’ll learn how to use Copilot to analyze variables using watch windows and visualizers.
-
Open the Products.razor file again from the Products project.
-
Add a breakpoint at the end of the OnInitializedAsync method.
-
Debug the TinyShop.AppHost and open the store from the .NET Aspire dashboard, and navigate to the Products page.
-
When the breakpoint is hit, hover over the imagePrefix variable.
-
Press the Copilot button to analyze the imagePrefix variable.

Note: you can also see these in the Locals or watch windows
-
Observe how Copilot provides detailed information about the variable, including its value and potential issues.
-
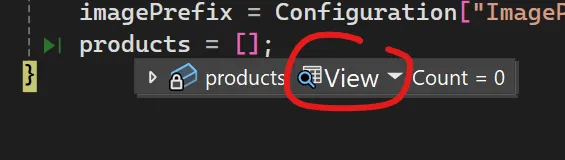
Hover over the products collection and click the View button with the magnifier icon.
-
Use the visualizer to inspect the contents of the products collection.
-
Click the Generate expression button and, in natural language, type:
Products that have the name outdoor in them and are under 40 dollars -
Observe how Copilot generates the appropriate expression automatically.
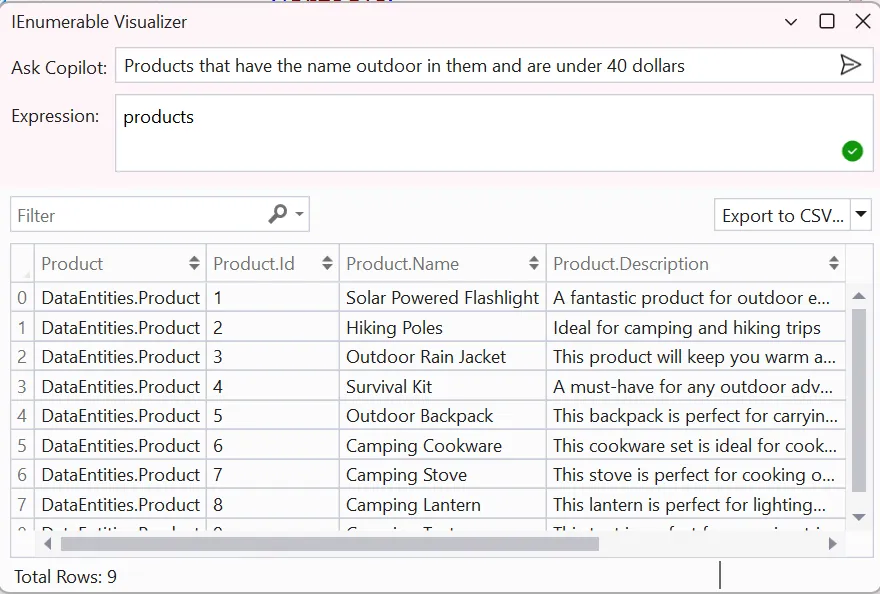
Key Takeaway: Copilot can enhance debugging by providing detailed insights into variables through watch windows and visualizers. Copilot can simplify complex debugging tasks by generating expressions and LINQ queries based on natural language input.
Check your understanding
Section titled “Check your understanding”Why can analyzing an exception from the Visual Studio debugger produce a more specific answer than describing it in a new chat?
Check your answer
The debugger can supply Copilot with the current call stack, code location, exception, and live variable values automatically. That runtime context lets Copilot reason about the execution state that actually failed instead of relying only on a written description. The same advantage applies when asking about a value from a watch window or data tip.
Go deeper: Debug with GitHub Copilot.
Back: Part 06 - Using Copilot Vision | Next: Part 08 - Commit Summary Descriptions